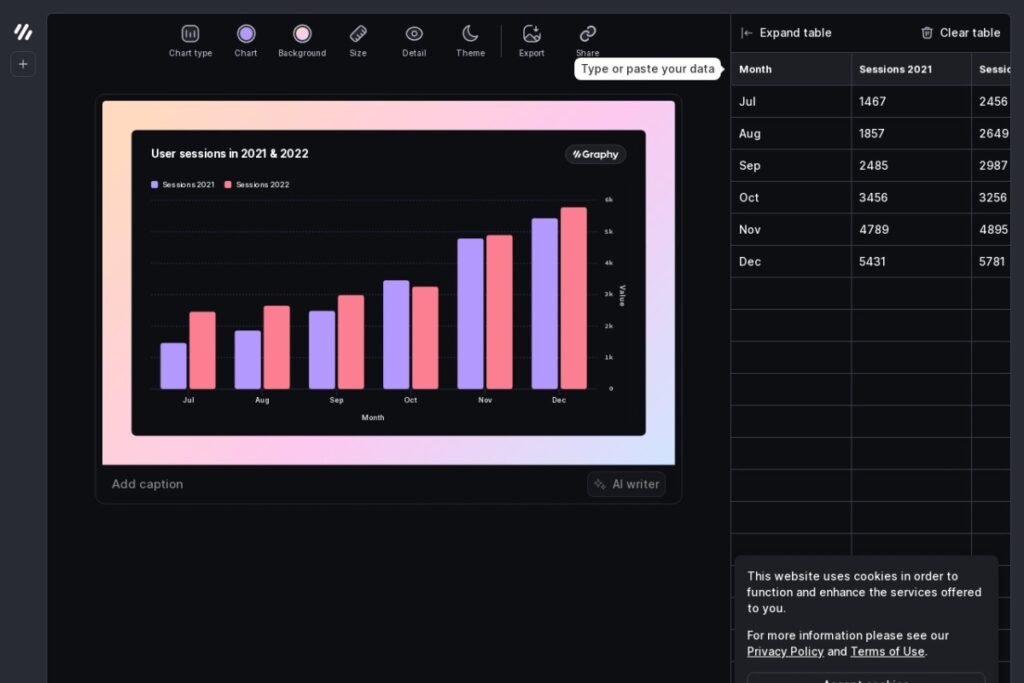
Graphy is a free chart-maker tool that allows you to create slick, interactive data visualisations. It’s designed to help you make your data stand out, whether you’re presenting it in a meeting, sharing it with your team, or embedding it into your Notion page or other platforms. With Graphy, you can turn your data into engaging and understandable visuals, making it easier for everyone to see and understand the insights your data holds. It’s a tool that brings your data to life, helping you communicate your ideas more effectively and make better, data-driven decisions.
ADded RECENTLY
FAST FOUNDATIONS AI WEEKLY
You’ll receive an email every Tuesday of Jim’s top three trending AI topics, tools, and strategies you NEED to know to stay on top of your game.


