Chartify

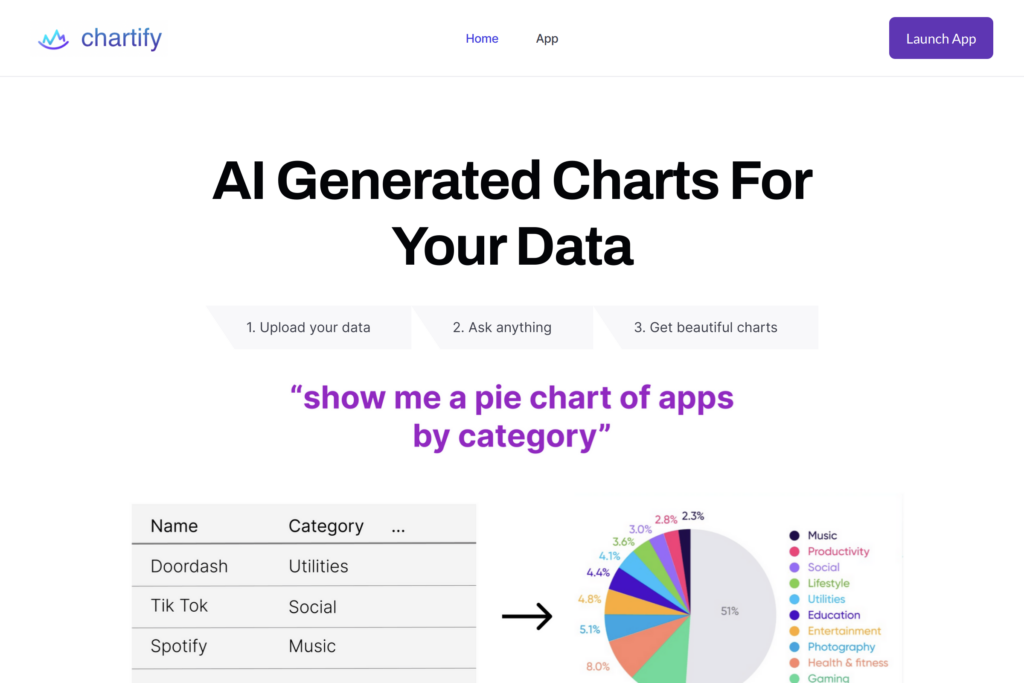
Chartify is a completely new way to interact with your data. No more using frustrating chart editors on Google Sheets and Excel or manually coding up charts in Plotly. 1. Upload your data Upload a CSV or connect to Postgres or MySQL 2. Get recommended visualziations We’ll show you some AI-recommended visualizations right away 3. Ask away See charts across Plotly, Matplotlib, Seaborn, and Charts.js

ADded RECENTLY

Faceless

A screenshot of https://faceless.so/

Faceless.so offers AI-powered faceless video generation for social media, automating content creation, scheduling, and posting across platforms like YouTube and TikTok.

Pikzels

A screenshot of https://pikzels.com/

Pikzels is an AI tool for creating viral thumbnails and titles, enhancing digital content with optimized visuals and text in seconds.

WisprFlow

A screenshot of https://wisprflow.ai/

AI-powered voice dictation tool for seamless speech-to-text functionality, enhancing productivity across devices and applications.

GoogleNotebookLM

A screenshot of https://notebooklm.google/

Google NotebookLM is an AI-powered tool for efficient note-taking and research, enhancing productivity and organization.

FAST FOUNDATIONS AI WEEKLY

You’ll receive an email every Tuesday of Jim’s top three trending AI topics, tools, and strategies you NEED to know to stay on top of your game.